Business Intelligent

Data is knowledge, and knowledge is power. Upon analysis, data’s key insights fuel a business, facilitating a competitive advantage. Dynamics 365 possesses the ability to perform the analysis through Report Wizard, a tool which generates reports in just a few steps without employing XML or SQL- based queries.
One may also generate complex reports by creating one's own custom report from the very beginning or using a Dynamics 365 template. The topics within the BI guide introduce the creation of complex reports using Microsoft Visual Studio - report writing tool, and Microsoft SQL Server Reporting Services - report engine.

Dashboards
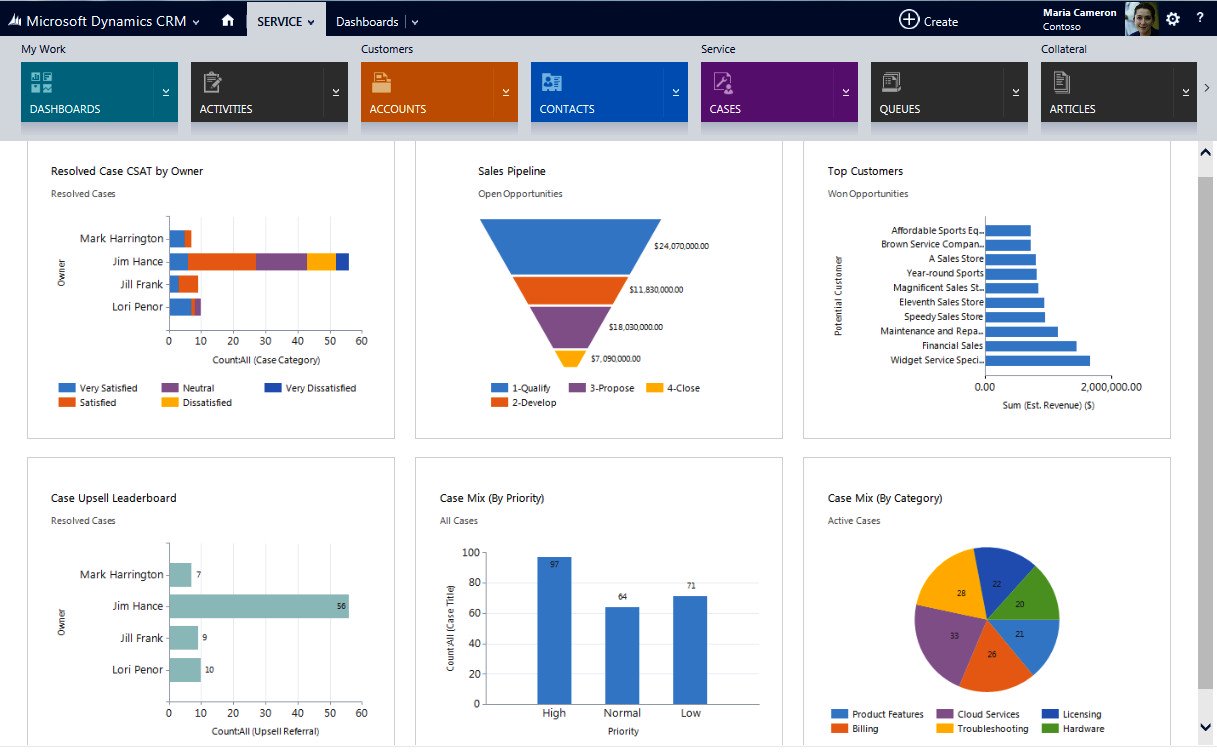
Dynamics 365 operates two different types of dashboards - user dashboards and system dashboards.
A private dashboard can be created by a user, which shall only be visible to them in their department, such as HR, Sales, or Marketing. System dashboards can be created/customized by an administrator or customizer which, when published, are visible to the entire organization. However, a user may choose to set their personal user dashboard as their default dashboard and override the system dashboard.

Power BI
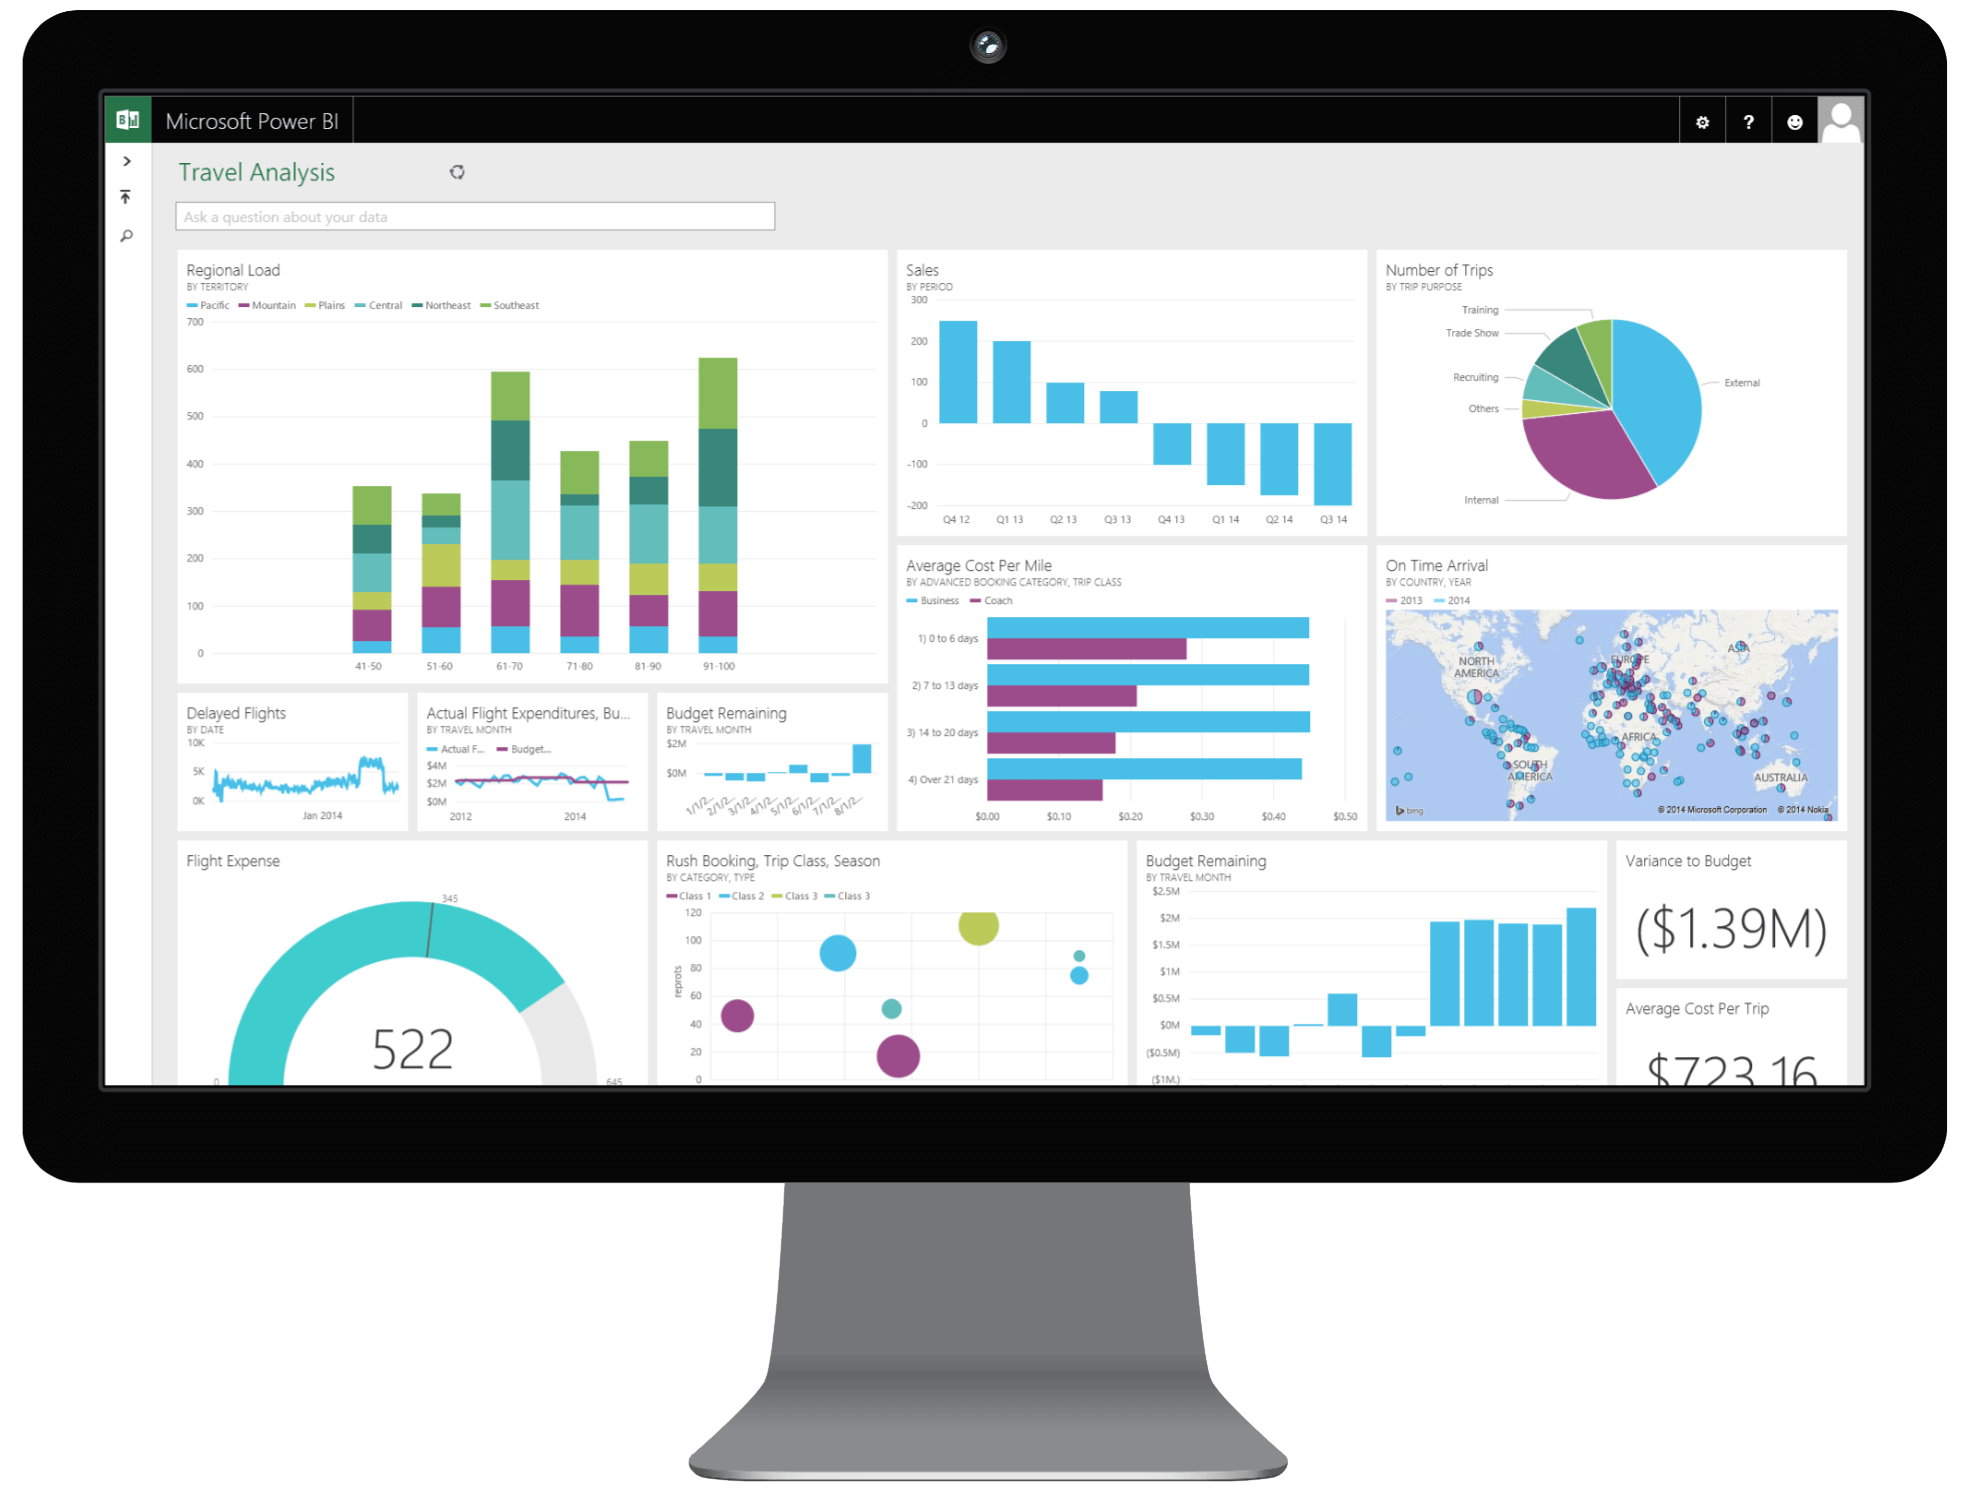
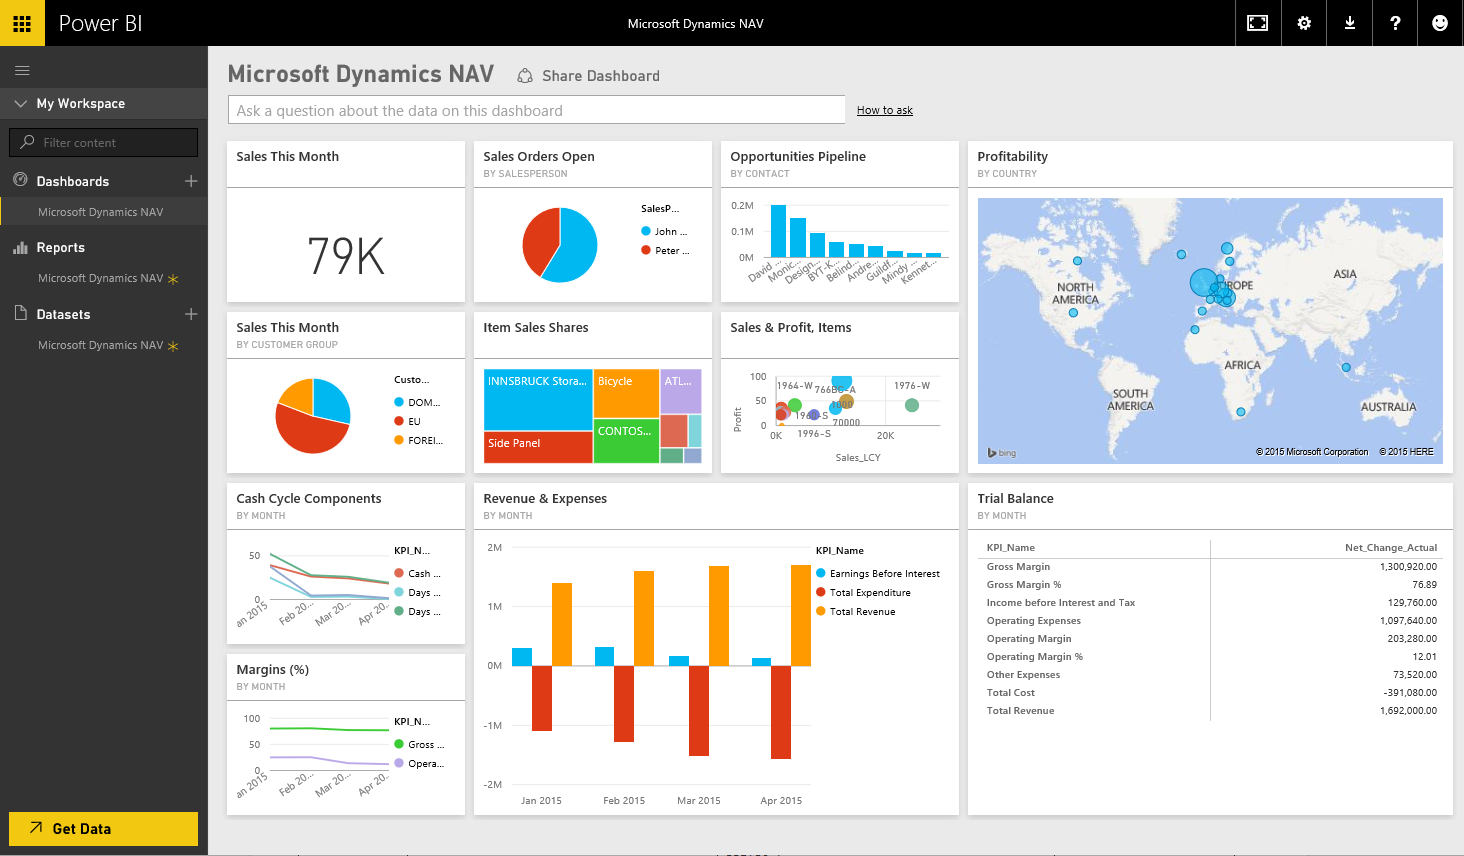
A self-service platform with the potential to facilitate discovery, analysis, visualization of data, and sharing or collaboration of insights with members of the organization. Power BI facilitates information workers and everyday business users with excellent data analysis and visualization capabilities to generate better business insights.
There are several ways one can integrate Power BI with Dynamics 365:
- Employing a Power BI Desktop - modification and customization of reports and visualizations at your fingertips.
- Embed a Power BI tile in a Dynamics 365 personal dashboard.
- Employ Power BI and Microsoft Office Excel together